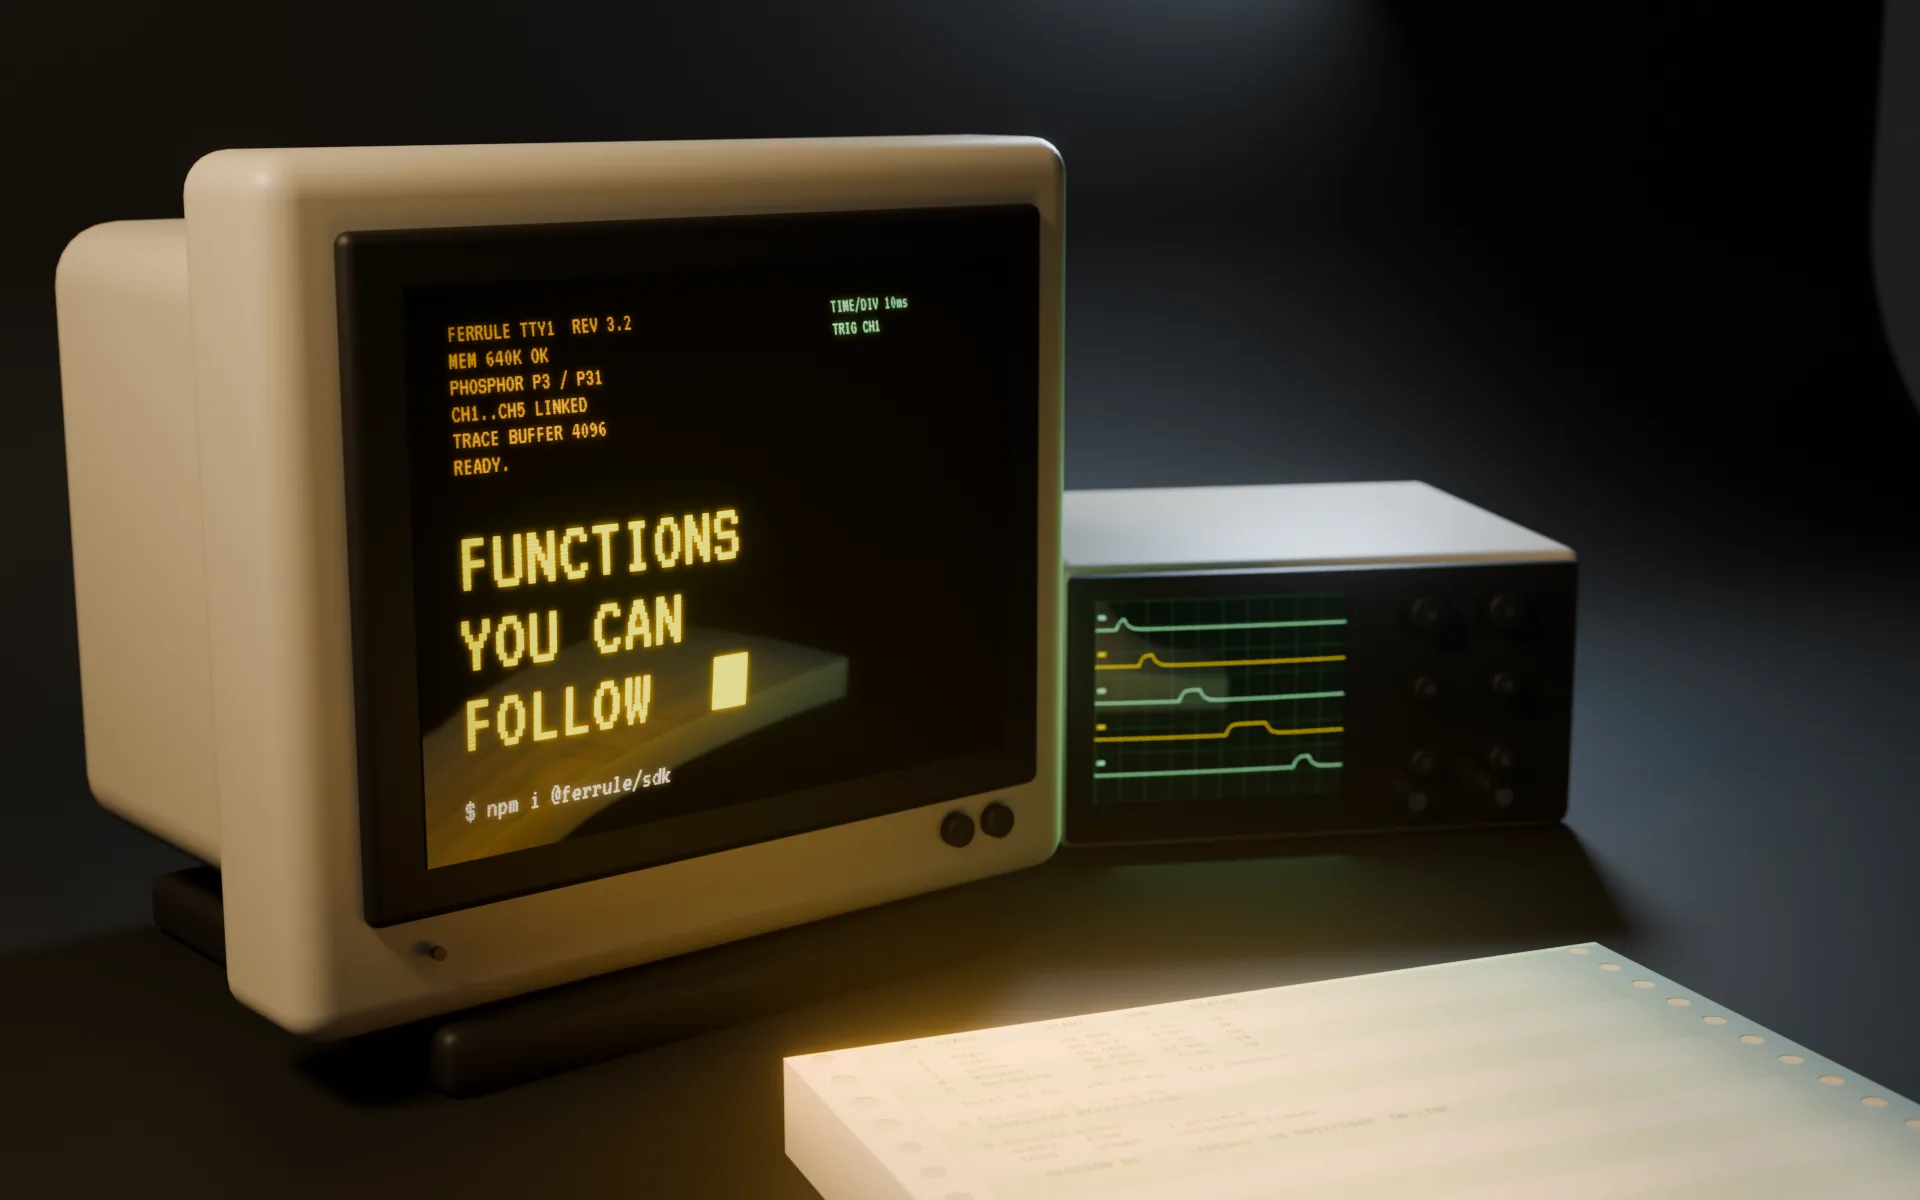
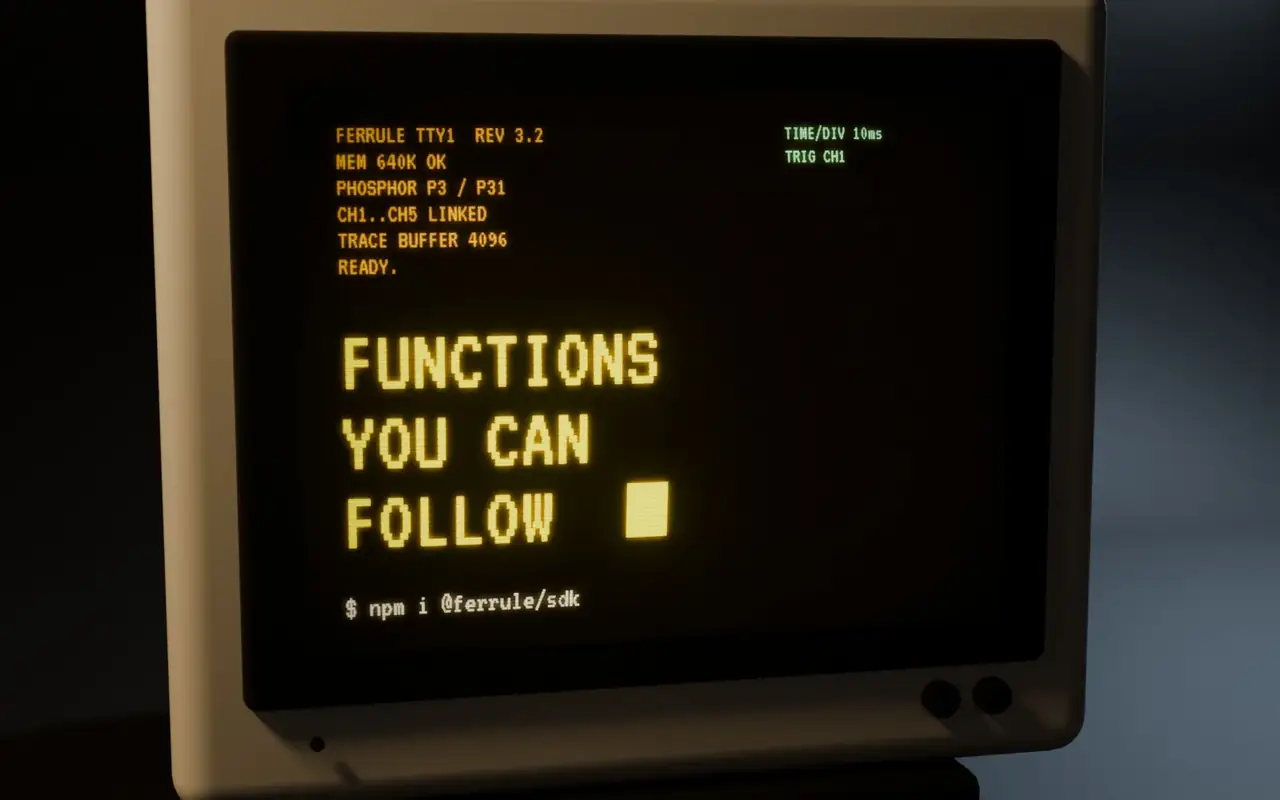
FERRULE LAB TERMINAL  v2.6 · tty1
MEM 640K OK · CLOCK 21:04 · LINK sin1 ── ok
CH1 EDGE ── armed    CH2 AUTH ── armed
CH3 QUEUE ── armed   CH4 FN ── armed   CH5 DB ── armed
TRIG ▲ CH1 · 5 ms/div · persistence ON
READY.
Functions you can follow
Ferrule runs your webhooks and edge functions next to your users and records every request as a trace, layer by layer. A slow checkout is one keystroke from its cause.
npm i @ferrule/sdk
- TIME/DIV
- 5 ms
- TRIG
- ▲ CH1 EDGE
- CURSOR
- X ---- Y ----
- SWEEP
- scroll ▾ to send a request
power --on tty1
Cold boot, every time
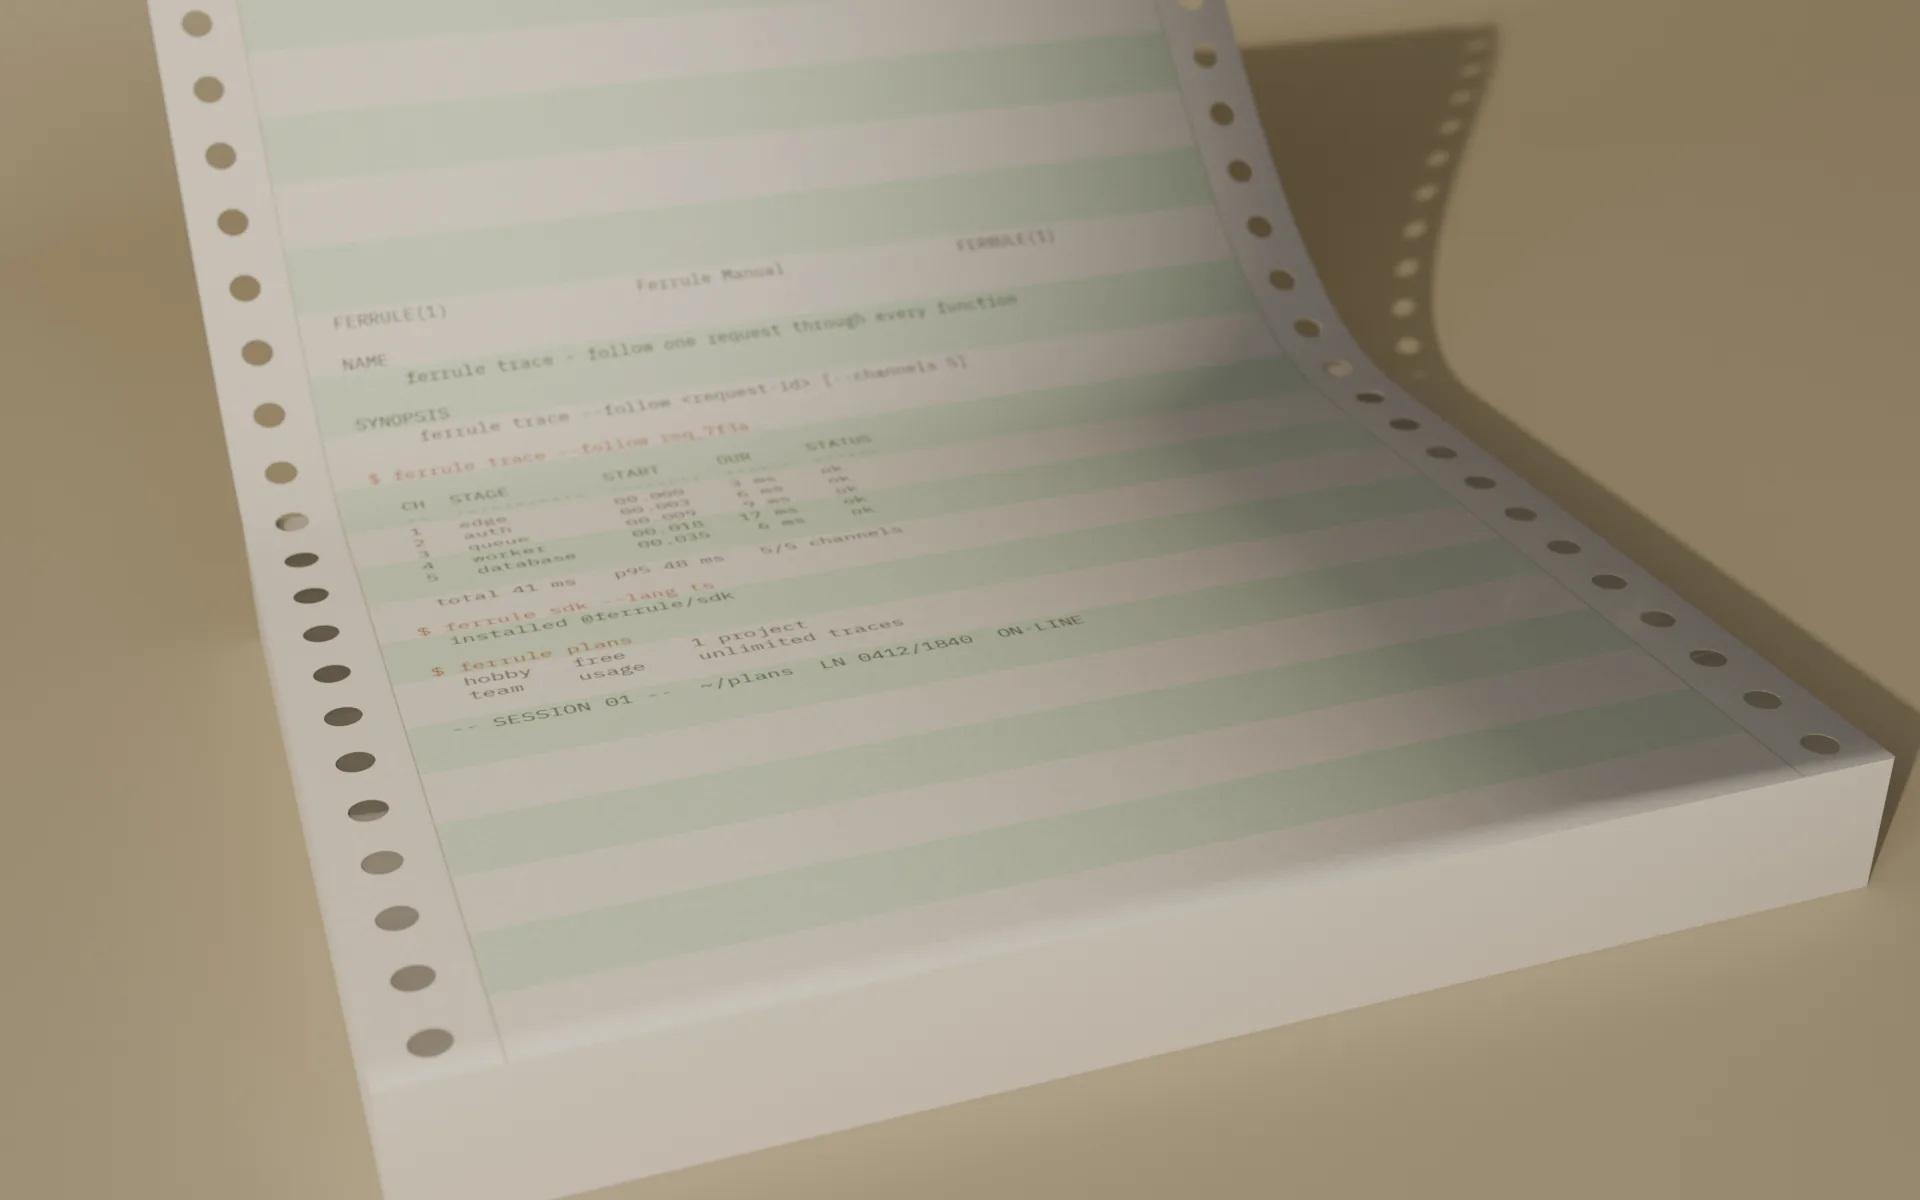
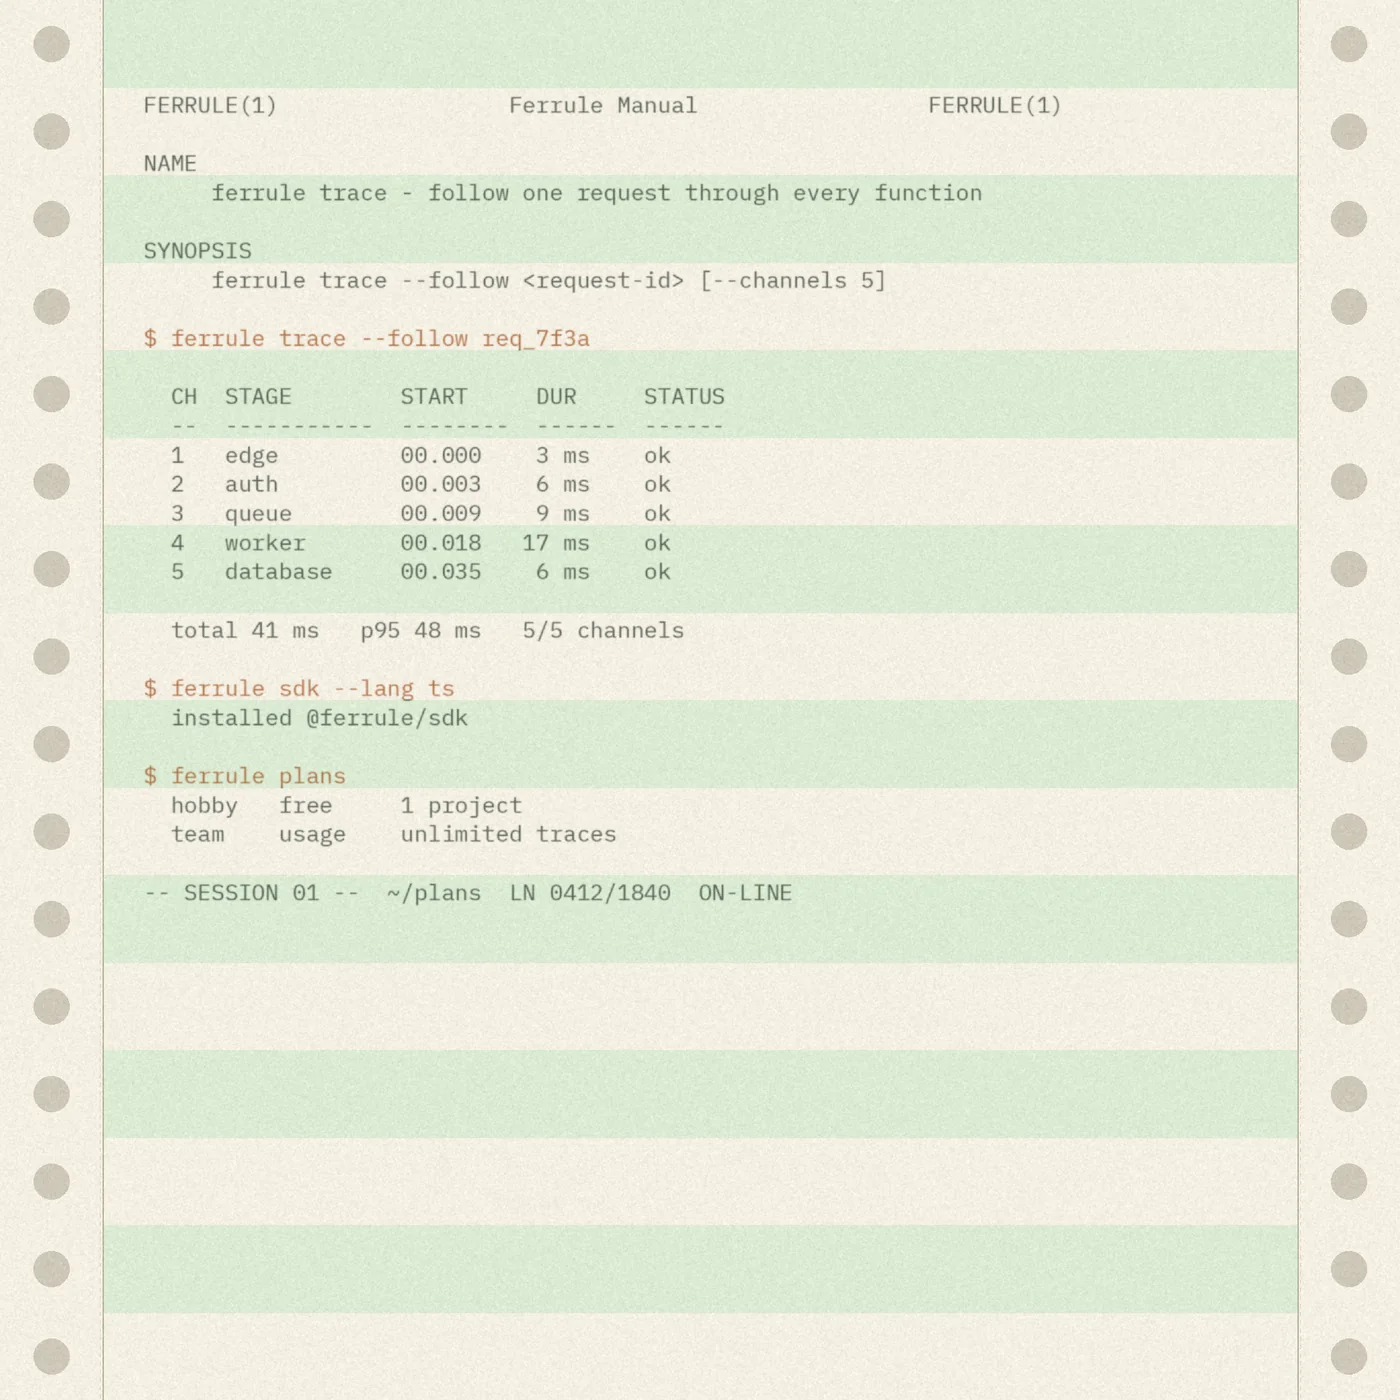
ferrule trace --follow
One request.
Five channels.
curl -X POST https://shop.example.com/api/checkout \
curl -X POST \
https://shop.example.com/api/checkout \
-H "Authorization: Bearer $SHOP_KEY" \
-d '{"cart":"c_8Q2","email":"[email protected]"}'
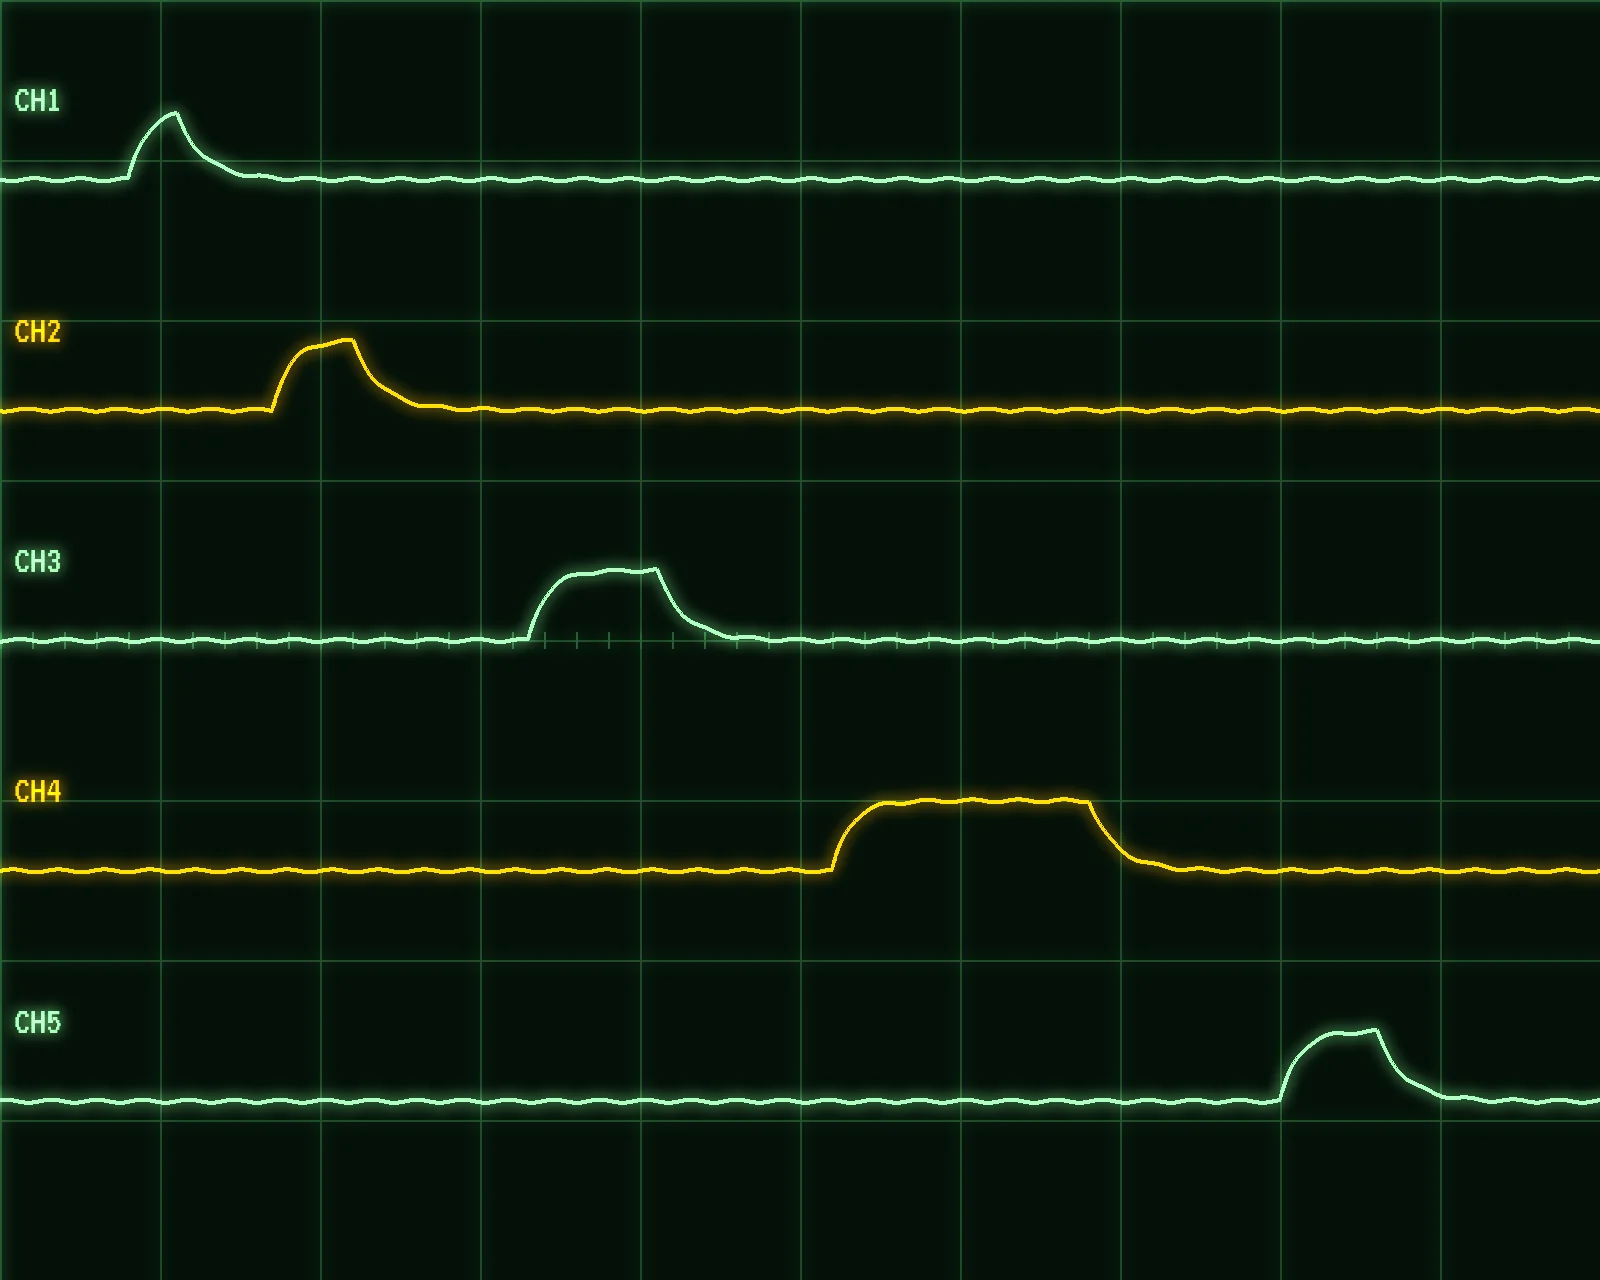
CH1 edgesin1 · tls1.3 · /api/checkout4ms
CH2 authfr_live_…3a9 · orders:write2ms
CH3 queueorders · key ck_7Q · depth 03ms
CH4 fncheckout.ts · warm · 3 logs31ms
CH5 dbcarts.get + orders.insert9ms
201 CREATED · tr_9f2c41 · 41ms
{"id":"ord_7Kq2Lm","status":"created",
"total":48.00,"trace":"tr_9f2c41"}
- CH1EdgeTerminates TLS in the nearest region and routes by path.
- CH2AuthChecks the key and its scopes before any code runs.
- CH3QueueHolds the job with an idempotency key, so a retry never charges twice.
- CH4FunctionRuns your TypeScript. Every log line lands in the trace.
- CH5DatabaseReads and writes are spans too, with the query attached.
ferrule scope --live
Measure it
yourself.
Fire a request at the bench scope. Each channel is one layer, each pulse is time spent there. Turn TIME/DIV until the slow one fits, then drag the two cursors across it. Δt is the answer.
- request
- POST /api/checkout · warm
- total
- 41.0 ms
- Δt
- 31.0 ms
- between cursors
- CH4 function
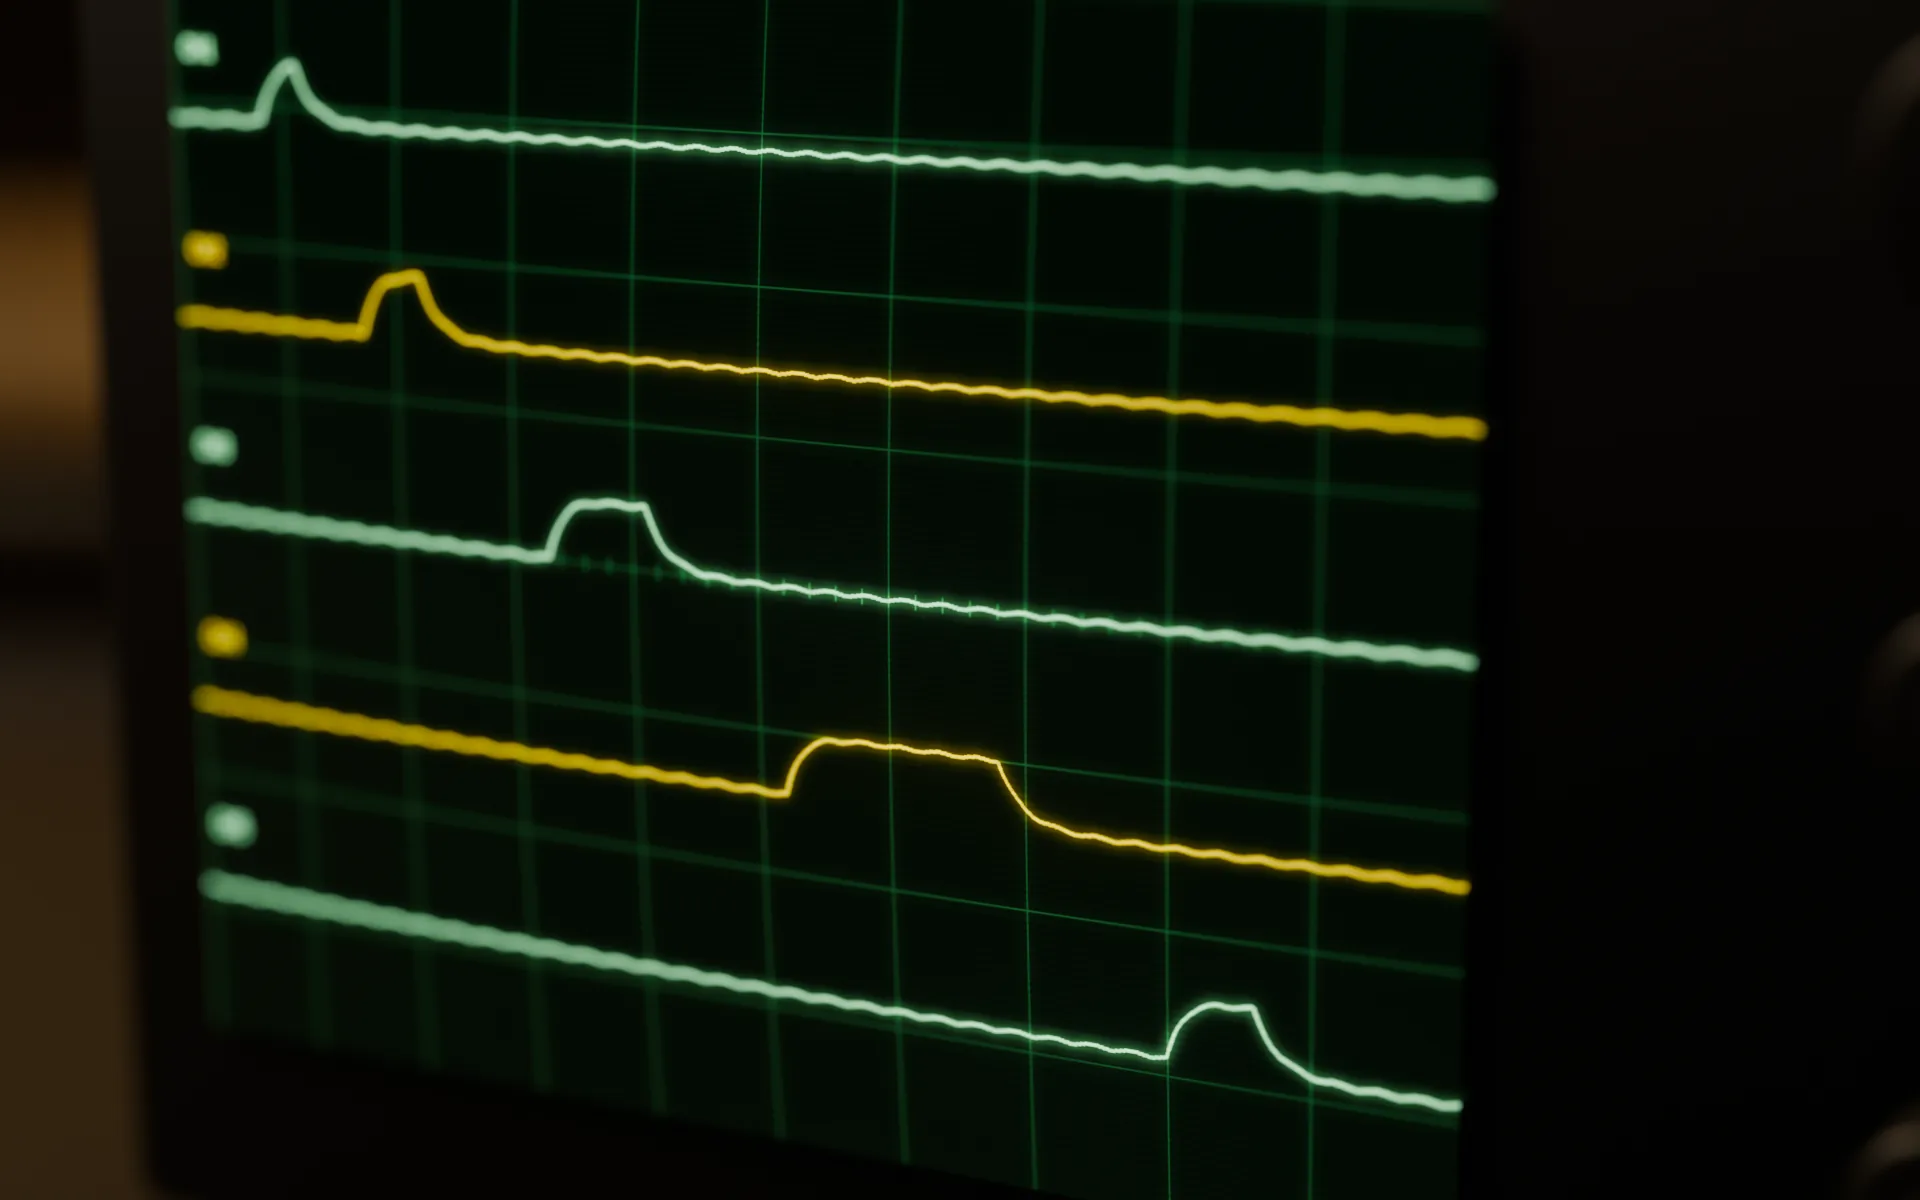
Example captures. Drag the cursors or focus them and use the arrow keys; the knob turns with a drag, a click or the arrow keys.
ferrule sdk --lang all
Same function.
Your language.
Every SDK hands your handler the same context: a logger that writes into the trace, a queue with retries, and a database client whose queries become spans. Or skip the SDK and call the HTTP API.
man 3 ferrule-sdkfunctions/checkout.ts
import { ferrule } from "@ferrule/sdk";

export default ferrule.fn("checkout", async (req, ctx) => {
  const { cart, email } = await req.json();
  const items = await ctx.db.carts.get(cart);   // span: CH5
  ctx.log("cart loaded", { items: items.length });

  const order = await ctx.queue.send("orders", { cart, email }, {
    idempotencyKey: req.headers.get("idempotency-key"),
    retries: 3,
  });
  return Response.json({ id: order.id, status: "created" }, { status: 201 });
});
functions/checkout.py
from ferrule import fn, Response

@fn("checkout")
async def checkout(req, ctx):
    body = await req.json()
    items = await ctx.db.carts.get(body["cart"])  # span: CH5
    ctx.log("cart loaded", items=len(items))

    order = await ctx.queue.send(
        "orders", body,
        idempotency_key=req.headers.get("idempotency-key"),
        retries=3,
    )
    return Response.json({"id": order.id, "status": "created"}, status=201)
functions/checkout.go
package functions

import "github.com/example/ferrule-go"

func Checkout(req *ferrule.Request, ctx *ferrule.Ctx) (*ferrule.Response, error) {
	var body struct{ Cart, Email string }
	if err := req.JSON(&body); err != nil {
		return nil, err
	}
	items, err := ctx.DB.Carts.Get(body.Cart) // span: CH5
	if err != nil {
		return nil, err
	}
	ctx.Log("cart loaded", "items", len(items))

	order, err := ctx.Queue.Send("orders", body, ferrule.Retries(3))
	if err != nil {
		return nil, err
	}
	return ferrule.JSON(201, map[string]string{"id": order.ID, "status": "created"}), nil
}
tty1
# deploy the folder, then call it over HTTP
npx ferrule deploy functions/

curl -X POST https://shop.example.com/api/checkout \
  -H "Authorization: Bearer $SHOP_KEY" \
  -H "Idempotency-Key: ck_7Q" \
  -d '{"cart":"c_8Q2","email":"[email protected]"}'

# print the trace of the last request
npx ferrule trace --lastferrule inspect --when it-breaks
When it breaks,
you are already watching.
-
(1)
Traces, without setup
Every request becomes a trace on its own. Layers, log lines and queries share one timeline, and the slow span is already marked.
-
(2)
Replay it against your fix
Pick a failed request, change the code, send the same request again to a preview. Same body, same headers, a new result.
-
(3)
Retries that can't double-charge
Queued jobs retry with backoff and carry their idempotency key. A job that keeps failing lands in a dead-letter queue you can read.
-
(4)
A preview for every push
Each branch gets its own URL, secrets and traces. Merge, and production runs the build you already tested.
+14ms  cart loaded   items=3
+26ms  price check   currency=USD
+38ms  order queued  id=ord_7Kq2Lm
$ ferrule replay tr_51ad07 --to fix-empty-cart
  before  500  12 ms   TypeError: items is undefined
  after   201  38 ms   ok
10:41:02  attempt 1   FAIL  502 payments provider
10:41:04  backoff     ....  2 s, same key
10:41:04  attempt 2   FAIL  timeout after 10 s
10:41:14  backoff     ....  8 s, same key
10:41:22  attempt 3   OK    order created
──────────────────────────────────────────
dead-letter queue: empty
| branch | commit | state | url |
|---|---|---|---|
| fix/empty-cart | a41c9e2 | preview | fix-empty-cart.shop.example.com |
| main | 7d0b113 | prod | shop.example.com |
| feat/gift-notes | e92f5a0 | building | … |
| chore/deps | 13ab0c4 | preview | chore-deps.shop.example.com |
ferrule plans --requests
Pay per request.
Never per seat.
log scale · function time up to 50 ms per request included
plan      PRO
base      $20.00
overage   0.0M × $0.40 = $0.00
$20/mo
Pro
10M included
| plan | price | requests | traces kept | extras |
|---|---|---|---|---|
| HOBBY | $0 | 1M | 7 days | one project |
| PRO | $20/mo | 10M, then $0.40/M | 30 days | replays, unlimited previews |
| SCALE | talk to us | volume | you choose | dedicated regions, SSO, support channel |
ferrule status --days 90
Uptime you can check.
EXAMPLE DATA · all systems normal
| region | p50 | state |
|---|---|---|
| sin1 singapore | 18 ms | normal |
| fra1 frankfurt | 21 ms | normal |
| iad1 virginia | 19 ms | normal |
| gru1 são paulo | 27 ms | normal |
ferrule log --oneline -5
Changelog
- a41c9e2cli
Replays from the CLI
ferrule replay tr_…sends a past request to any preview and prints both responses side by side. - 7d0b113traces
Database spans carry the query plan
Slow queries keep their plan in the trace, folded until you open it.
- e92f5a0sdk
Go SDK, first stable release
Same context as the TypeScript and Python SDKs: logger, queue and database client.
- 13ab0c4queues
Dead-letter queues you can read
Failed jobs keep body, headers and every attempt. Requeue one or all.
- 5c2e8f1deploys
Per-branch secrets
Previews read their own secrets, so a test key never reaches production.
ferrule help faq
Questions
Do I have to change my code to get traces?
No. Requests through Ferrule are traced at the edge, auth and queue layers on their own. The SDK adds your log lines and database queries to the same trace.
Where does my function run?
In the region closest to the caller by default. Pin a function to one region when it needs to sit next to its database.
What counts as a request?
One HTTP call or one delivered webhook. Retries of a queued job count once, however many attempts it takes.
Can I bring my own database?
Yes. Point the database client at Postgres or MySQL with a connection string; queries still show up as spans.
How long are traces kept?
Seven days on Hobby, thirty on Pro, as long as you need on Scale. Export any trace as JSON.
Is Ferrule a real product?
No. Ferrule is a fictional example for an Inazda UI template. Swap in your own product, prices and links.
npx ferrule init
Deploy in five minutes.Read your first trace in six.
npx ferrule init
Connection to ferrule closed.